
November 19, 2021 — As we discussed in our recent webinar, QuartzBio’s virtual Sample Inventory Management (vSIM) solution empowers clinical operations and translational research teams by integrating multiple sources of sample information, both within and across studies.
The platform enables users to interact with harmonized data from multiple sources, gain critical insights via KPI and data issue reporting, and manage queries resulting from those data inconsistencies.
The challenge: one team, multiple biomarker-informed studies, multiple data sources
One of the core challenges faced by sponsors in biomarker-informed clinical trials is the integration of key sample and subject metadata derived from multiple independent sources. For example, a single study will typically have information scattered across EDC systems and inventory or LIMS systems.
For a concrete illustration, in this use case, we describe a relatively standard setup of the system for two immuno-oncology studies, for which we have data coming from multiple sources, in multiple formats:
- Electronic Data Capture (EDC)
- Central lab laboratory information management system (LIMS)
- Four distinct specialty labs LIMS systems
- Biorepository
This example case is intended to be representative of the typical complexity we see in biomarker-informed studies. Managing all of this data manually in Excel or similar tools would be incredibly time consuming and require access to each of the systems mentioned.
The solution: QuartzBio virtual Sample Inventory Management (vSIM)
To address the challenges of manually tracking, mapping, and reconciling metadata coming from diverse systems, we have developed the virtual Sample Inventory Management (vSIM) solution within the QuartzBio platform. vSIM automatically integrates and harmonizes sample information from multiple sources regardless of format or data quality.
Within vSIM, sponsor teams can leverage the Master Sample Inventory, a single, interactive hub to browse, visualize, and download the harmonized sample data within and across studies.
Anonymized sample data from the two clinical trials in this example are shown in the Master Sample Inventory view below (Figure 1). The Master Sample Inventory presents users with a harmonized view of sample metadata, ensuring that differences in data entry are mapped to a robust, common data dictionary.
Sponsors can easily find the subjects and samples they’re interested in with advanced filtering and customization capabilities, and then download bespoke sample manifests for downstream dashboarding or operations needs.
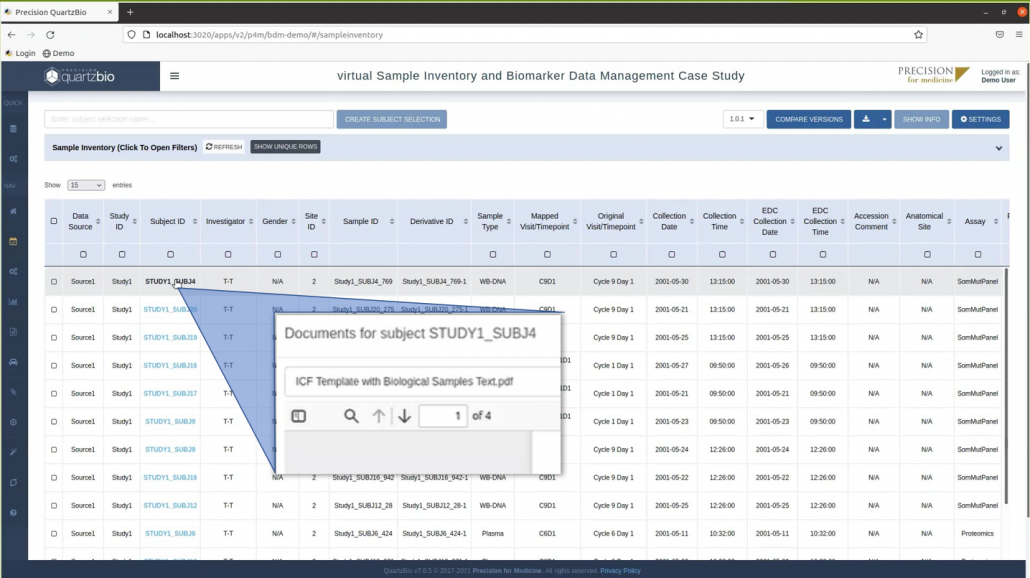
Figure 1. Master Sample Inventory User Interface. The Master Sample Inventory provides a tabular view of key sample metadata, with each row indicating either a sample or a derivative aliquot. Each sample is mapped back to a study, site, and subject ID. Clicking the subject ID opens a modal for accessing all information on that subject, including consent information.
Visualizing data within and across studies
In addition to browsing, filtering, and exporting data, translational research teams can further leverage the vSIM platform to create visualizations that answer key on-study questions, such as:
- “How does the number of available plasma samples compare to the number of available FFPE samples for Study X?”
- “What proportion of samples have data available? What’s the breakdown of data availability by sample type?
Selecting the relevant metadata columns in the Master Sample Inventory generates on-the-fly visualization, showing either the breakdown of samples available by study, the breakdown by sample type, or both at once.
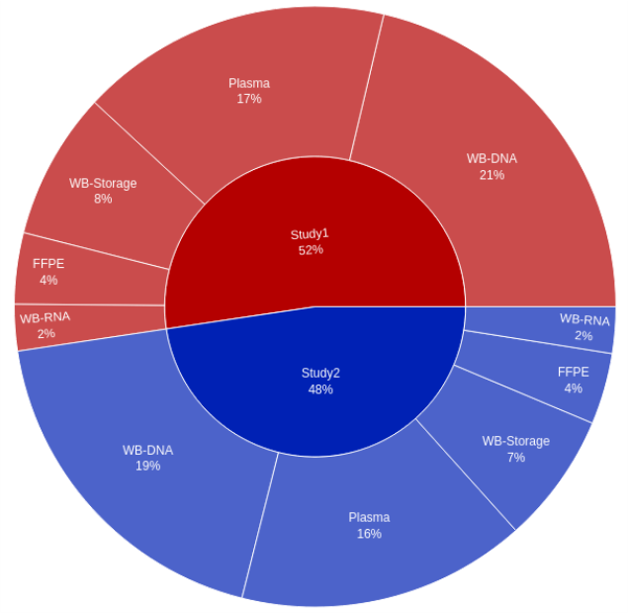
Figure 2. Visualization of Study ID versus Sample Type. The Master Sample Inventory provides out-of-the-box visualization capabilities that enable sponsors to answer key on-study questions and, in this example, gain insight into sample collection by study.
In this way, sponsors can easily generate custom visualizations to address specific questions about sample collection. To revisit any of the visualizations later, they can be saved to a custom dashboard, shareable with other members of the study team and exportable in a variety of formats.
View a full demonstration of QuartzBio’s vSIM platform by watching our webinar on demand – we show how this solution can help turn biorepositories into engines for drug development.