February 12, 2021 — Integrating clinical and biomarker data enables both operational insights as well as scientific insights that can help teams make clinical trial decisions on-study.
Our last article defined the synthesis of these insights as translational intelligence, with the potential to illuminate key insights in drug development just as business intelligence is used to optimize business performance. We showed that, for example, having all the biomarker and clinical data linked together enables sponsors to quickly explore the relationship between drug response status and specific biomarkers of interest.
In this post, we further illustrate how translational intelligence works in practice with example applications. Translational intelligence not only illuminates key trends that may be missed through manual data review, but it also facilitates the seamless exploration of interlinked clinical, PK, and exploratory biomarker data assets.
Applying Smart Algorithms to Interconnected Biomarker and Clinical Data
Often, translational and clinical teams are evaluating various biomarkers and their relationship with PK and clinical data.
To determine which set of biomarkers may warrant further interrogation, unsupervised clustering of correlated biomarker data with therapeutic responses can expand analyses and prioritize hypotheses for deeper exploration that might otherwise have been missed by visual inspection alone, as we described in our last article.
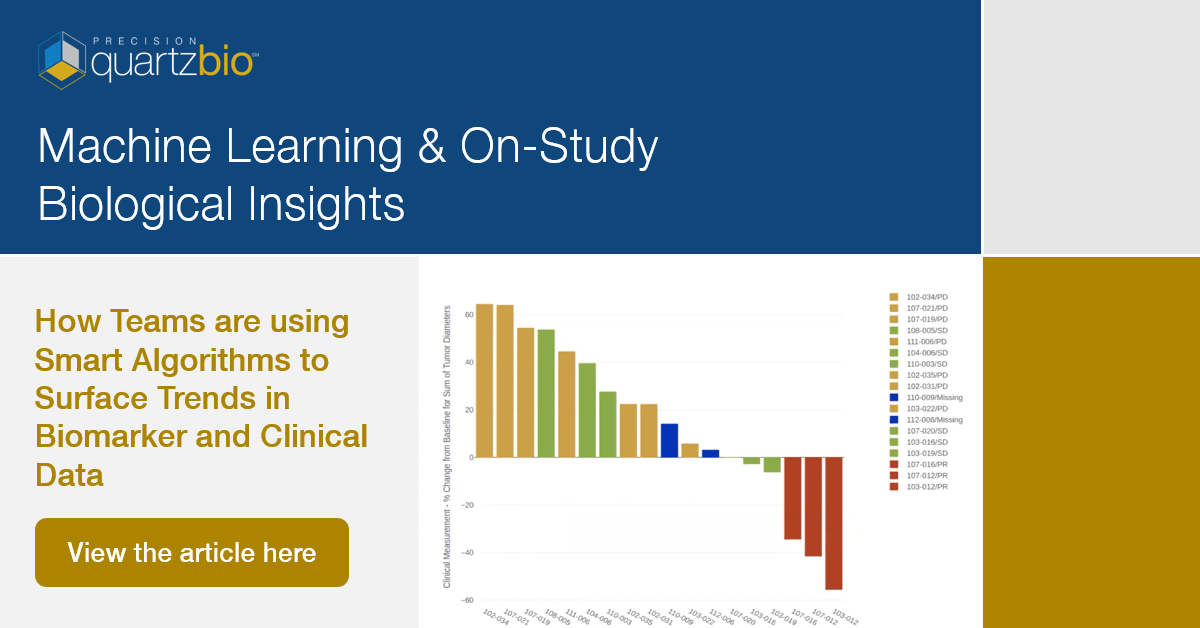
Following clustering / enrichment, further investigation may, for example, involve tracking changes in biomarker gene expression with respect to drug exposure (Figure 1). Alternatively, analyzing the change in tumor measurements in a biomarker-defined subgroup of patients (Figure 2) may also be useful for informing on-study decisions.
Figure 1. Patient trajectories reveal changes in biomarker gene expression with respect to drug exposure

Figure 2. Waterfall plot reveals change in tumor diameters in a subgroup of trial subjects

Upon initial evaluation of the biomarker data, the next step is confirming whether interesting findings have scientific merit, which might require further inspection of an image or a closer look at all the clinical data associated with selected biomarkers.
Too often, the necessary information exists within legacy data silos. In contrast, an integrated data asset can be configured to flexibly enable the often-unpredictable path of scientific insight generation, as shown in Figure 3.
Figure 3. Correlation of Biomarker Gene Expression with Overall Survival

Figure 3. With QuartzBio, sponsors can correlate biomarker gene expression with overall survival, then display Kaplan-Meier survival curves for a biomarker of interest.
Watch our on-demand webinar, where we will include a demonstration of our analysis engine in action! By registering, you will gain access to the live event, the on-demand recording, and a custom demonstration for your team if you’re interested.

